aero_fileplot#
Generates 3-D surface plots of an AeroDatabase — one figure for stability derivatives and one for control derivatives at a reference beta.
Plot AeroDatabase tables as 3-D surface plots (port of aero_fileplot.m).
- avl_aero_tables.aero_fileplot.aero_fileplot(aero, beta_ref=0.0)[source]#
Plot stability and control coefficient tables from an AeroDatabase.
Produces two sets of figures:
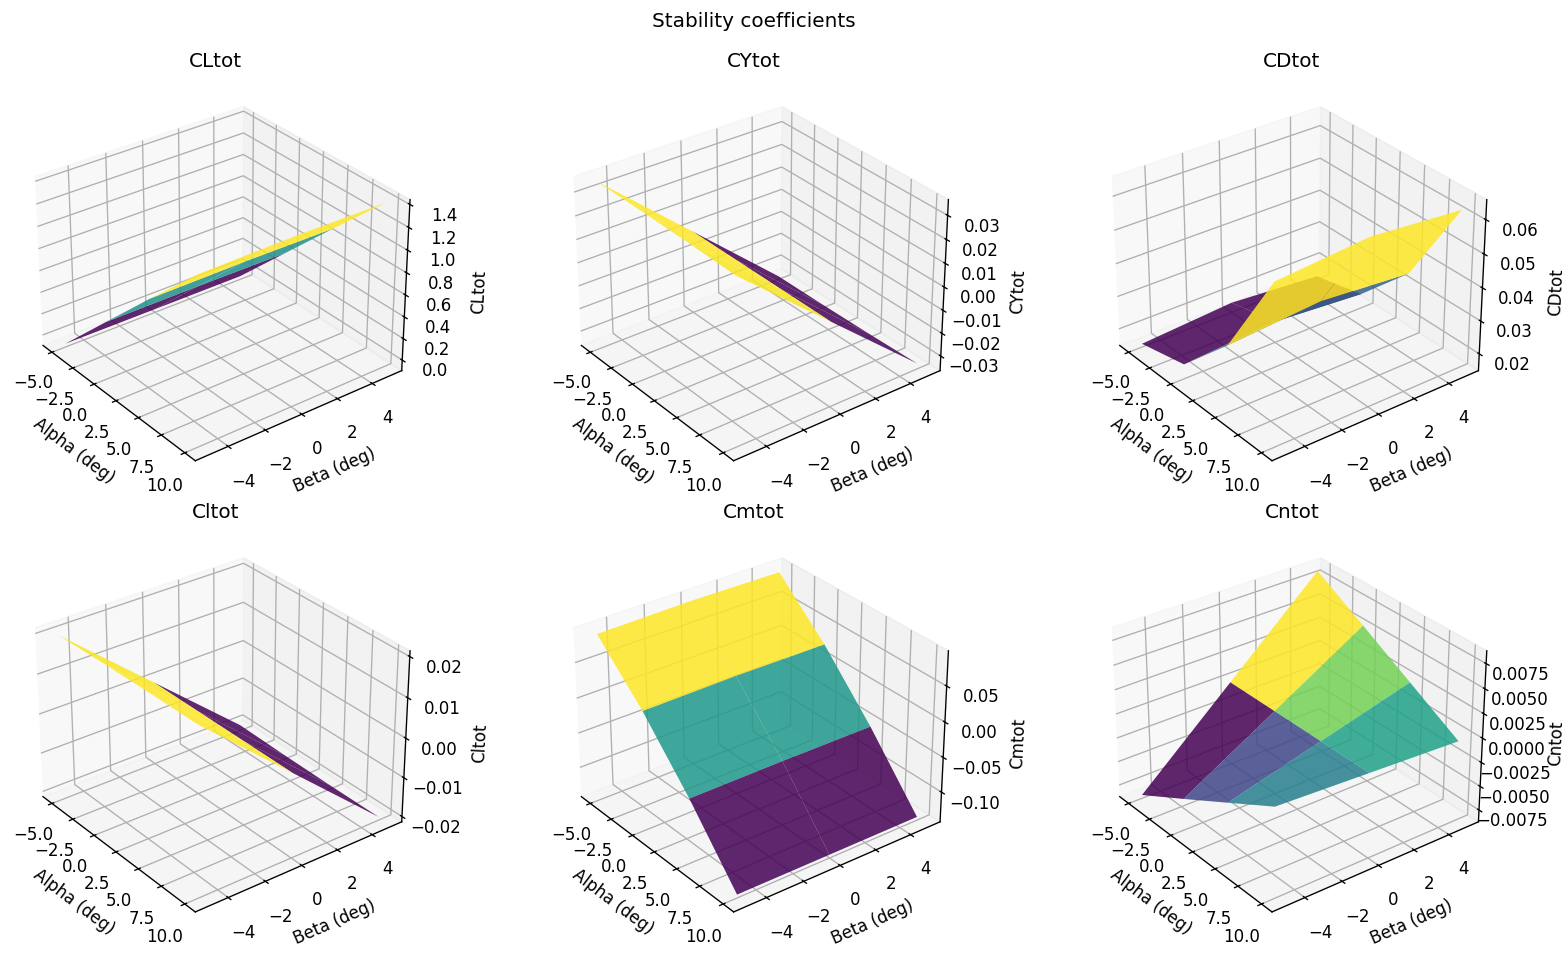
Stability figure — 2×3 grid of 3-D surface plots showing each of the six total-force coefficients vs. alpha and beta.
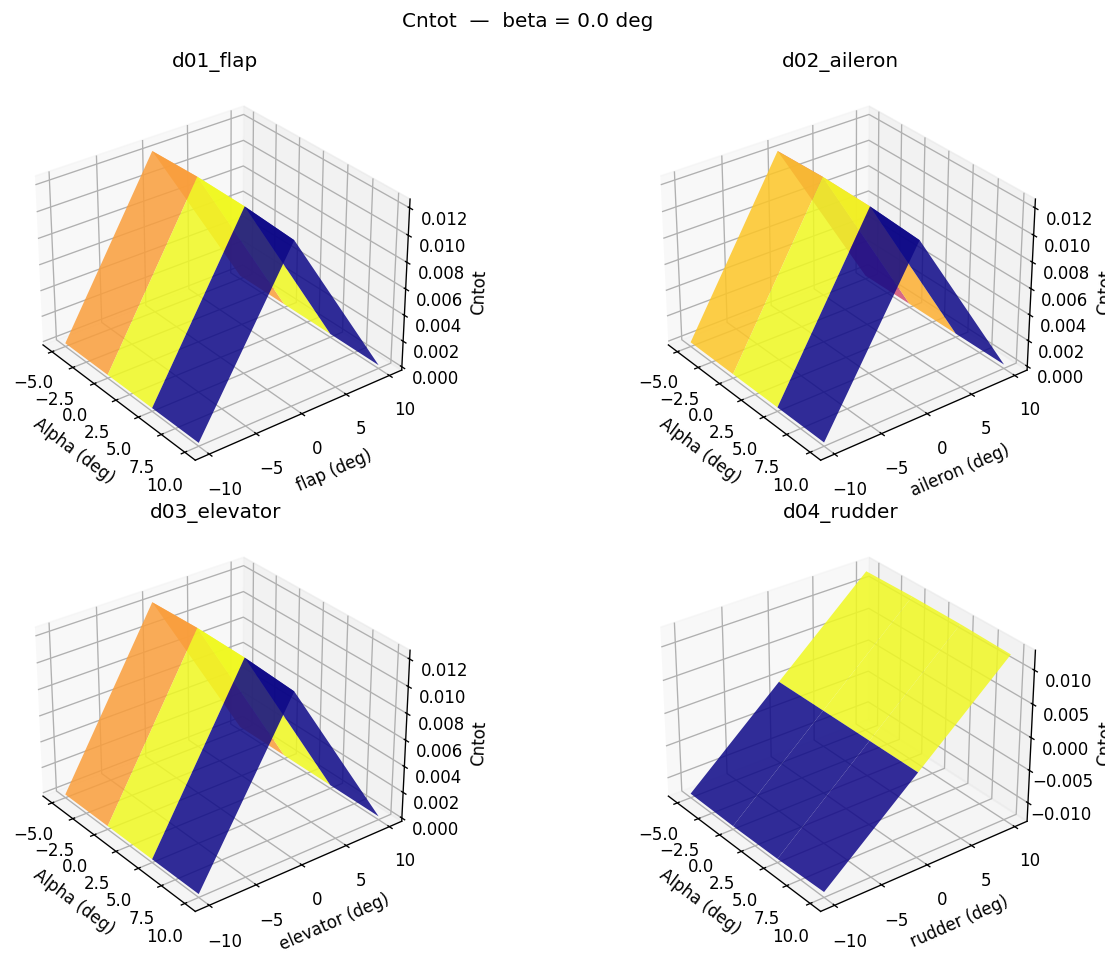
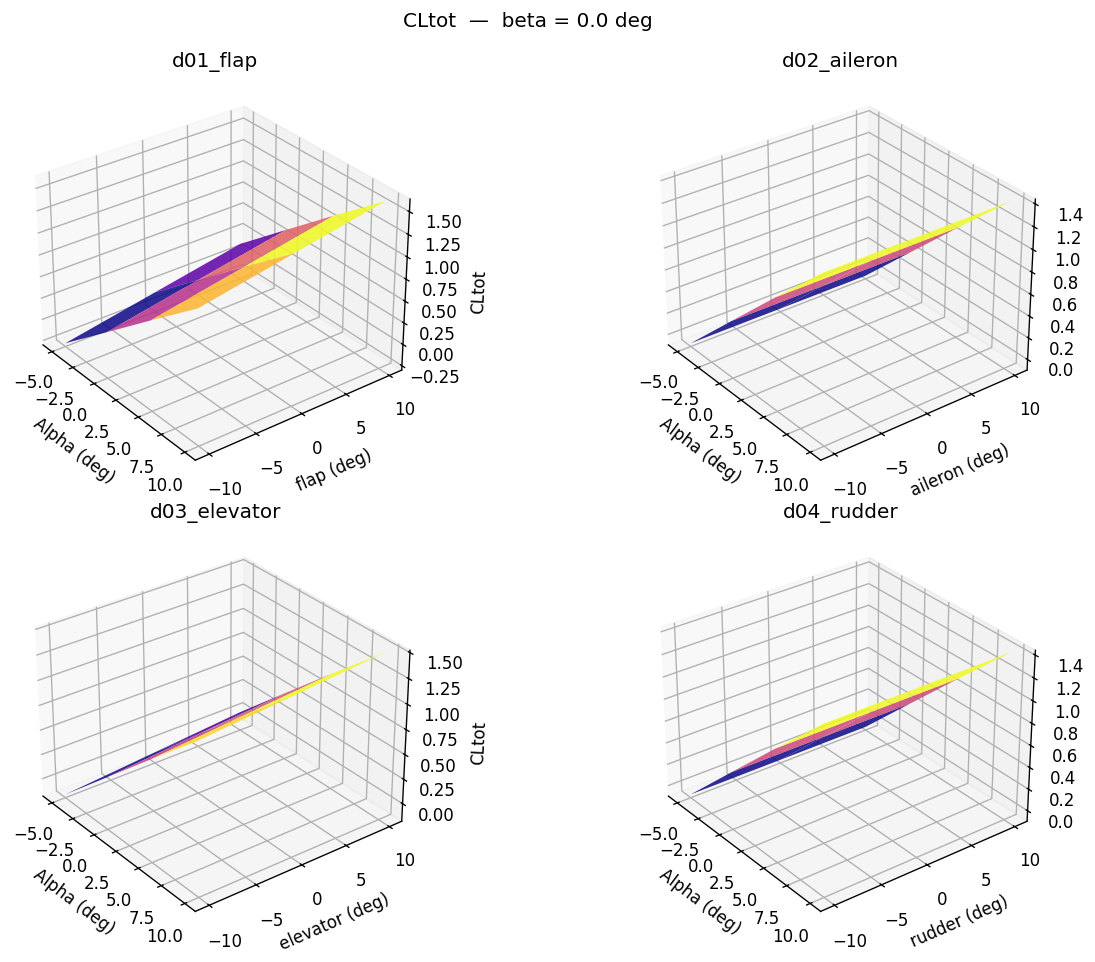
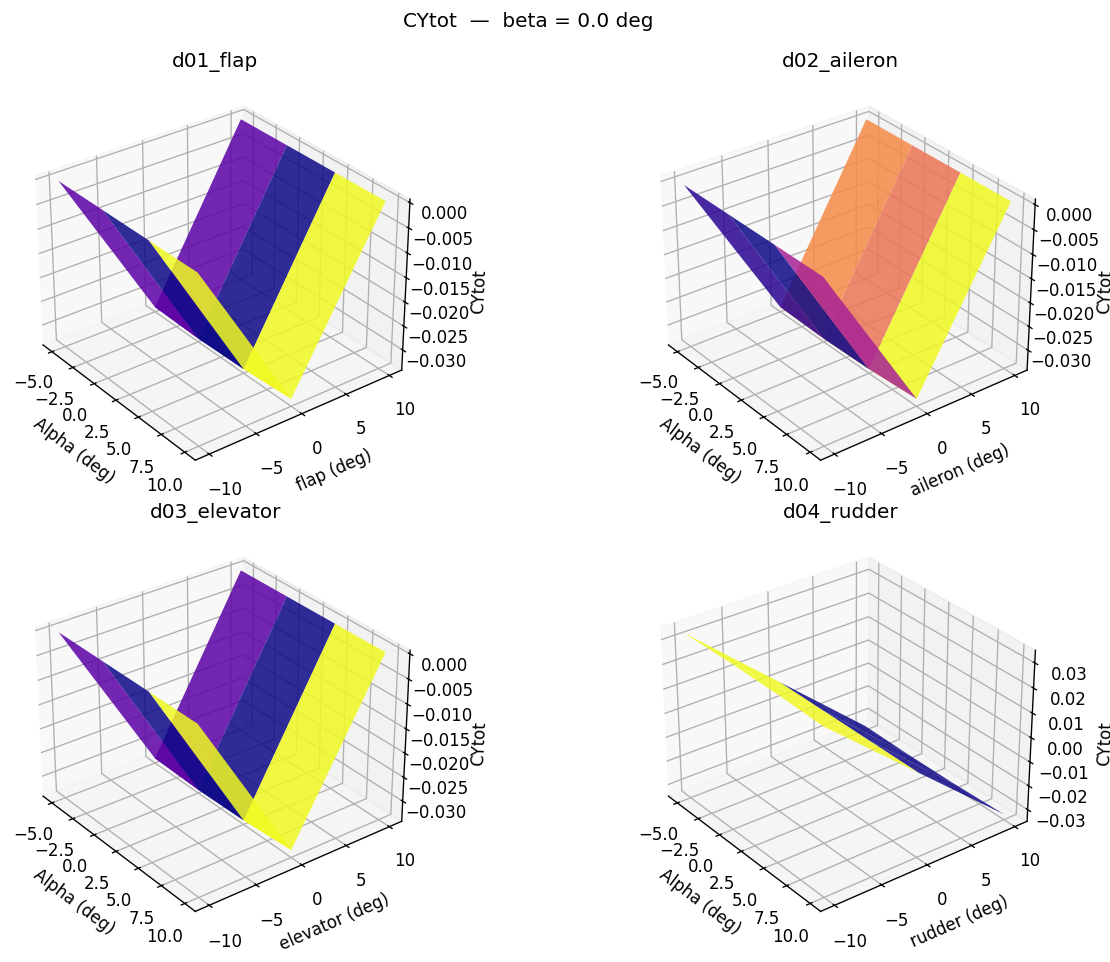
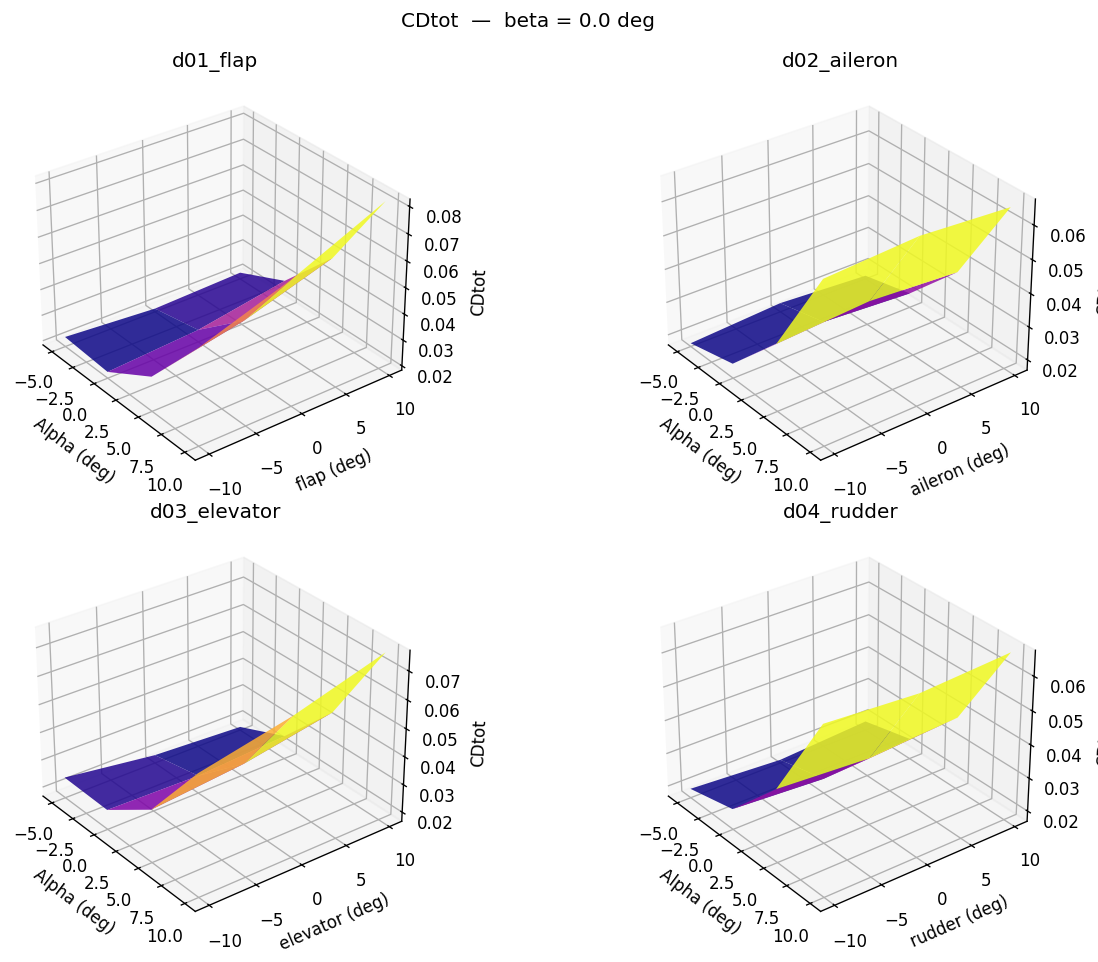
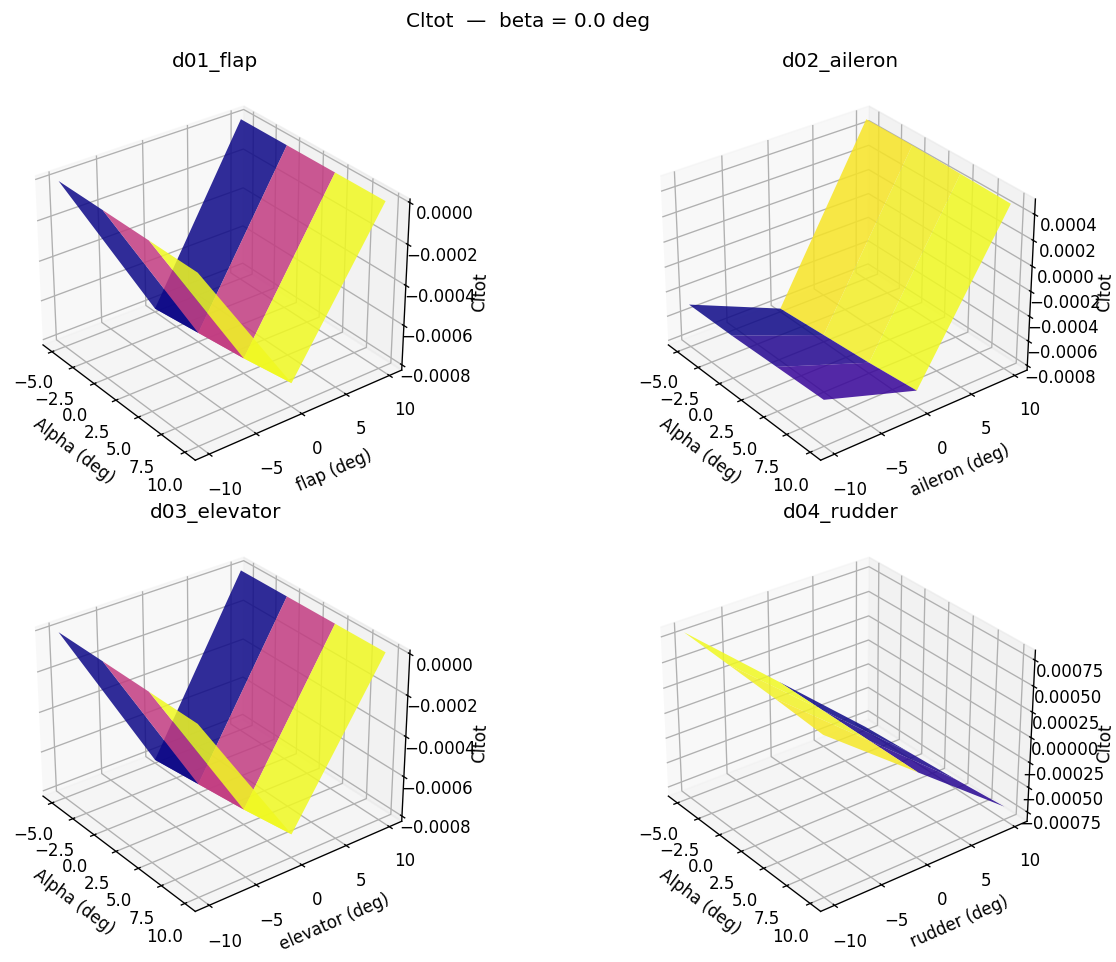
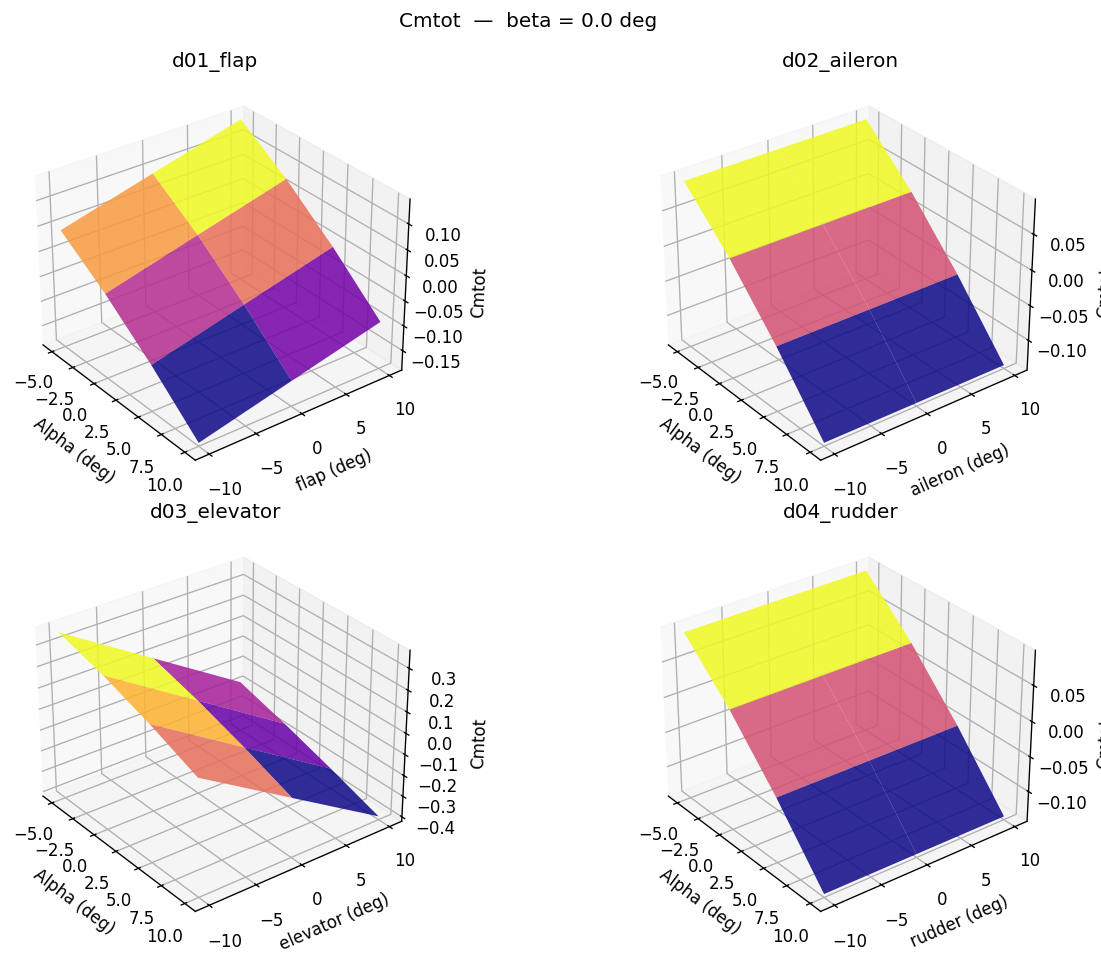
Control figures — one figure per coefficient, each containing one subplot per control surface, showing the coefficient vs. alpha and deflection at beta_ref.
- Parameters:
aero (AeroDatabase) – AeroDatabase built by aero_filewrite().
beta_ref (float) – Sideslip angle (deg) at which control-surface subplots are sliced. The nearest available beta breakpoint is used.
- Returns:
Stability figure first, then one control figure per coefficient. Returns an empty list for any set that cannot be plotted (e.g. no control surfaces).
- Return type:
list[plt.Figure]
Example
>>> from avl_aero_tables import avl_sweep
>>> from avl_aero_tables.aero_filewrite import aero_filewrite
>>> from avl_aero_tables.aero_fileplot import aero_fileplot
>>> results = avl_sweep(
...     "examples/bd.avl",
...     alpha=[-5, 0, 5, 10],
...     beta=[-5, 0, 5],
...     ctrl_sweeps={"elevator": [-10, 0, 10]},
... )
AVL sweep complete → ...  (36 cases)
>>> db = aero_filewrite(results)
>>> figs = aero_fileplot(db)
>>> len(figs)  # stability + one figure per coefficient
7
>>> figs[0].get_suptitle()
'Stability coefficients'
>>> figs[1].get_suptitle()
'CLtot  —  beta = 0.0 deg'
Example output#
figs[0] — Stability coefficients vs alpha × beta#
figs[1] — CLtot vs alpha × deflection#
figs[2] — CYtot#
figs[3] — CDtot#
figs[4] — Cltot#
figs[5] — Cmtot#
figs[6] — Cntot#